Saturday, May 5, 2018

EXPERIMENT 5: ANALYSIS OF CHLORPYRIFOS IN WATER BY SOLID-PHASE EXTRACTION (SPE) AND GAS CHROMATOGRAPHY- ELECTRON CAPTURE DETECTOR (GC-ECD)


CHM510
ANALYTICAL SEPARATION METHOD


EXPERIMENT 5:
ANALYSIS OF CHLORPYRIFOS IN WATER BY SOLID-PHASE EXTRACTION (SPE) AND GAS CHROMATOGRAPHY- ELECTRON CAPTURE DETECTOR 
(GC-ECD)


INTRODUCTION


Figure 1: Chlorpyrifos


Chlorpyrifos is a crystalline organophosphate insecticide that acts on the nervous system of insects by inhibiting acetylcholinesterase. Chlorpyrifos is moderately toxic to humans and the exposure will cause neurological effects such as persistent developmental disorders auto-immune disorders and children mental development retard due to the exposure during pregnancy. In agriculture, chlorpyrifos remains as one of the most widely used as the pesticide. Solid-phase extraction (SPE) is an extraction method that uses solid and liquid phase to isolate analyte from solution. It is a rapid and selective sample preparation. The purpose of using the SPE is to purify, trace enrichment, solvent exchange and derivatization. The advantages of the SPE are high recovery of analyte, concentration of analyte, ease of automation and reduction of organic solvent consumption. The general procedure of SPE is the loading of solution through SPE phase, wash away undesired components, and lastly wash off the desired analytes with other solvent into the collection tube. Steps of SPE are from column solvation and equilibration, sample loading, interference elution and lastly, the analyte elution. The objectives of this experiment are to calculate the amount of chlorpyrifos and each waste water sample and also the percentage of recovery. 


PROCEDURE

a)      Filter Water Sample Through A Glass Fibre Filter Paper
It was prepared well by Supervisor.

b)      Solid-phase Extraction Procedure
C18 SPE cartridge was conditioned by passing 10 mL of methanol. The cartridge was rinsed by passing 6 mL of deionized water without applying vacuum. Then, the filtered water sample was passed through the preconditioned column using a vacuum manifold at ~6 mL per min (about 48 drops min-1). The column should not be allowed to dry during this sample enrichment step. The column was dried by vacuum for 15 minutes. The interference was removed by eluting the column with 10 mL of deionized water and the cartridge was dried by vacuum for 30 minutes. The cartridge was placed into tube rack. After that, the pesticide was eluted using 5 mL of hexane. The sample was concentrated to 1 mL by blowing down using gentle nitrogen and the sample were sealed by using parafilm for GC analysis.


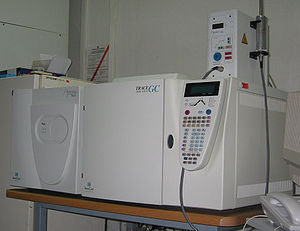
c)      Instrument Set-up
Injector Temperature: 280oC
Detector Temperature: 300oC
Carrier Gas Flow Rate: 20.0 mL min-1 (Nitrogen)
Column Temperature: Initial Temperature 165oC for 3 minutes, increase to 260oC at 3oC min-1 with final time of 2 minutes


d)      Quantitative Analysis Of Chlorpyrifos
1 µL of sample was injected onto the column. The injection was repeated to get reproducible peak areas. Then, 1 µL of standard chlorpyrifos were injected and repeated to get reproducible peak area. The concentrations of chlorpyrifos in the sample were calculated using the data from standard solution.


RESULTS


A.     Comparison in retention time of standard and sample;

Retention time of standard (ppm)
Sample
Retention time of sample (min)
Average retention time of sample (min)
Trial 1
Trial 2
5.145
1
5.148
5.148
5.148
2
5.149
5.150
5.150
3
5.146
5.146
5.146


A.     Calculation of response factor for standard compound;


= 30 ppm/ 247.1895 Hz*s
= 0.0333 ppm/Hz*s


A.     Amount of Chlorpyrifos in samples;

Amount of chlorpyrifos in sample= Peak area of sample x Response Factor (standard)


Sample
Area (Hz*s)
Average area (Hz*s)
Amount of chlorpyrifos(ppm)
Trial 1
Trial 2
1
443.1896
459.2441
451.2169
15.0255
2
421.0789
404.0869
412.5829
13.7390
3
181.9961
236.5716
209.2839
6.9692

Average amount of chlorpyrifos in sample (ppm):


=(15.0255+13.7390+6.9692)/3   = 11.9112 ppm


A.     Percentage of recovery of samples;


DISCUSSION


In this analysis, GC with Electron Capture detector is used because the analyte to be analysed is halogenated compound. ECD only can detect analytes which contain electronegative functional groups that can capture electrons such as halogens, peroxides, quinones and nitro groups. The disadvantage of ECD is it involve radioactive component. The amount of chlorpyrifos in samples is calculated by using response factor calculation that base on the standard compound. The amount of chlorpyrifos in each sample does not show big different, it show that same procedure was carried out to each sample. The average amount of chlorpyrifos in the samples is 11.9112 ppm, that is about half from the amount of chlorpyrifos in the standard. The percentage recovery calculated is 39.71% in average. In order to get higher amount of chlorpyrifos or the percentage recovery, the SPE must be carried out carefully so it will extract more chlorpyrifos efficiently.


CONCLUSION

The average amount of chlorpyrifos in sample is 11.9112 ppm and the percentage recovery is 39.71%.


REFERENCE


1.   Nor’ashikin S., Ruziyati T., Mardiana S. (2012), Analytical Separation Methods Laboratory Guide (2nd edition).


EXPERIMENT 4: ANALYSIS OF HYDROCARBONS IN COMMON FUELS BY SOLID-PHASE MICROEXTRACTION (SPME) AND GAS CHROMATOGRAPHY- MASS SPECTROMETRY (GC-MS)


CHM510
ANALYTICAL SEPARATION METHOD


EXPERIMENT 4:
ANALYSIS OF HYDROCARBONS IN COMMON FUELS BY SOLID-PHASE MICROEXTRACTION (SPME) AND GAS CHROMATOGRAPHY- MASS SPECTROMETRY (GC-MS)


INTRODUCTION

Solid-phase microextraction is a sample preparation technique that use fibre coated with extracting phase that extract different kinds of analytes for different fibre coating. The analytes can be in the form of liquid or gas either volatile or not. In this experiment, head space SPME is used where the fibre is exposed in the vapour phase above a gaseous sample. Head space SPME is suitable for the analysis of volatile organic compounds, and it is important to keep the headspace volume constant and keep the fibre position at the same depth for every analysis. The amount of analyte extracted by the fibre depends on the concentration of the analyte in the sample as long as equilibrium reached. After the extraction process was done, the fibre is transferred to the injection port of GC where desorption of the analyte takes place and the separation occur. The factors that affect the SPME performance are the coating material, thickness of fibre, sample agitation, sample pH, salt addition and the extraction procedure. The objective of this experiment is to identify the major hydrocarbons components in common fuels (diesel, petrol, thinner and an unknown) by using SPME-GC-MS.


REAGENT AND SOLUTION
Accelerants: Unleaded petrol, diesel, paint thinner and unknown.


INSTRUMENT
Gas Chromatograph (Agilent Technologies 6890N) equipped with HP 5971A mass selective detector (MSD) and a 30 m x 250 µm x 0.25 µm HP5-MS capillary column.


PROCEDURE
a)      Instrument Set-Up
Injector Temperature: 250oC
Detector Temperature: 300oC
Carrier Gas Flow Rate: 30 mL s-1
Column Temperature: 60oC to 170oC at 10oC min-1


b)      SPME Procedure
The fibre (100 µm polydimethylsiloxane[PDMS] in a GC Injection port was conditioned about 10 minutes at 250oC to remove contaminants. 5mL of sample in a glass vial was added with septum and the vial was placed on a hot plate. The sample was heated to 50oC and agitated the sample using a magnetic stirrer. The SPME fibre was exposed to the headspace of the vial for 20 minutes. The fibre was withdraw into the needle, pulled out from the vial and injected into the GC-MS with desorption time 80 seconds. The major compounds in each sample were identified using mass spectra library.


RESULTS


A.     Major compounds presence in petrol sample;

Retention Time (min)
Area (%)
Quality
Compound
4.09
12.07
97


o-Xylene
5.63
2.09
97


Mesitylene
6.53
1.28
97


Benzene, 1,2,3-trimethyl-
7.54
0.39
97


Benzene, 2-ethyl-1,4-dimethyl-


B.      Major compounds presence in diesel sample;

Retention Time (min)
Area (%)
Quality
Compound
10.66
10.17
94


Tridecane
11.79
3.11
98


Decahydro-1,1,4a,5,6-pentamethylnaphthalene
12.02
15.13
97


Tetradecane
14.79
4.26
98


Hexadecane


C.      Major compounds presence in thinner sample;

Retention Time (min)
Area (%)
Quality
Compound
2.80
100.00
91


Toluene

D.     Compound of unknown that match with compound in petrol;
Retention Time (min)
Area (%)
Quality
Compound
6.05
8.25
95


Benzene,1, 2, 3-trimethyl-
6.53
3.68
93


Mesitylene


E.      Compound of unknown that match with compound in petrol;

Retention Time (min)
Area (%)
Quality
Compound
9.22
9.84
95


Dodecane
11.79
2.85
99


Decahydro-1, 1, 1, 4a, 5, 6-pentametylnaphthalene
12.01
8.92
97


Tetradecane
13.29
3.69
96


Pentadecane


DISCUSSION

From the analysis done, 4 major compounds presence in petrol sample are o-xylene, mesitylene, benzene, 1, 2, 3-trimethyl- and benzene, 2-ethyl-1, 4-dimethyl- that lie from retention time of 20 minutes to 33 minutes of analysis. Diesel sample show the trend of major compound peaks from 7 minutes to 18 minutes that respond to tridecane, decahydro-1, 1, 4a, 5, 6-pentamethyl-naphthalene, tetradecane and hexadecane based on the mass spectra library.

The unknown sample analysis shows that the unknown sample is the combination of diesel and petrol based on the similarities of some of the major compounds presence in diesel and petrol. The major compounds presence in the unknown are Benzene,1, 2, 3-trimethyl- and mesitylene that is presence in petrol while dodecane,decahydro-1, 1, 1, 4a, 5, 6-pentametylnaphthalene, tetradecane, pentadecane presence in diesel. There is a retention time that is presence in thinner and the unknown that at 2.54 minutes, but since the quality is lower that is 64, the assumption cannot be made because it has the possibilities to be other compounds. The advantage of using SPME is that the extraction is simple, fast and can be done without any solvents. If the samples are properly stored, it can be analyzed days later without much loss of volatiles.


CONCLUSION

The major compounds presence in petrol o-xylene, mesitylene, benzene, 1, 2, 3-trimethyl- and benzene, 2-ethyl-1, 4-dimethyl-. The major compounds presences in diesel are tridecane, decahydro-1, 1, 4a, 5, 6-pentamethyl-naphthalene, tetradecane and hexadecane. Thinner only show a single peak that corresponds to toluene. It can be concluded that the unknown sample is the mixture of diesel and petrol since there are some major compounds of diesel and petrol presence in the unknown.


REFERENCE
1.  Nor’ashikin S., Ruziyati T., Mardiana S. (2012), Analytical Separation Methods Laboratory Guide       (2nd edition).